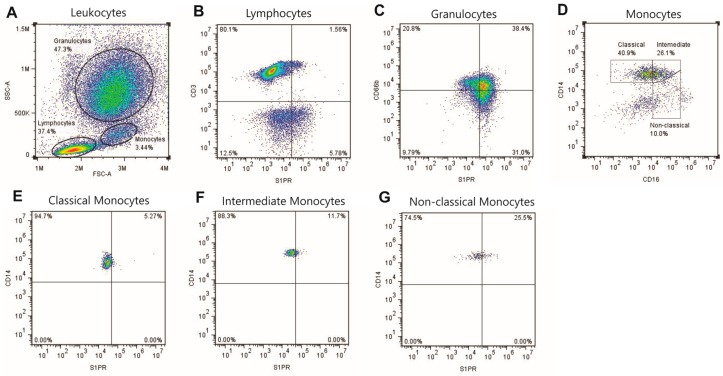
Figure 4.
Leukocyte-gating strategy for the measurement of S1PRs in cells subpopulations. Leukocytes were identified in a SSC/FSC plot for granulocytes, lymphocytes, and monocytes selection (A); The lymphocyte gate was copied to a CD3/S1PR plot to identify T-cells expressing S1PRs (CD3+/S1PR+) (B); The granulocyte population was copied to a CD66b/S1PR plot identifying granulocytes that present S1PRs (CD66b+/S1PR+) (C); To identify monocytes subsets, monocytes were copied to a CD14/CD16 plot and divided into three populations: classical monocytes (CD14++/CD16−), intermediate monocytes (CD14++/CD16+), and non-classical monocytes (CD14+/CD16++) (D); Each monocyte population were copied to a CD14/S1PR plot to evaluate the presence of S1PRs in these monocytes (E, F, and G, respectively).

