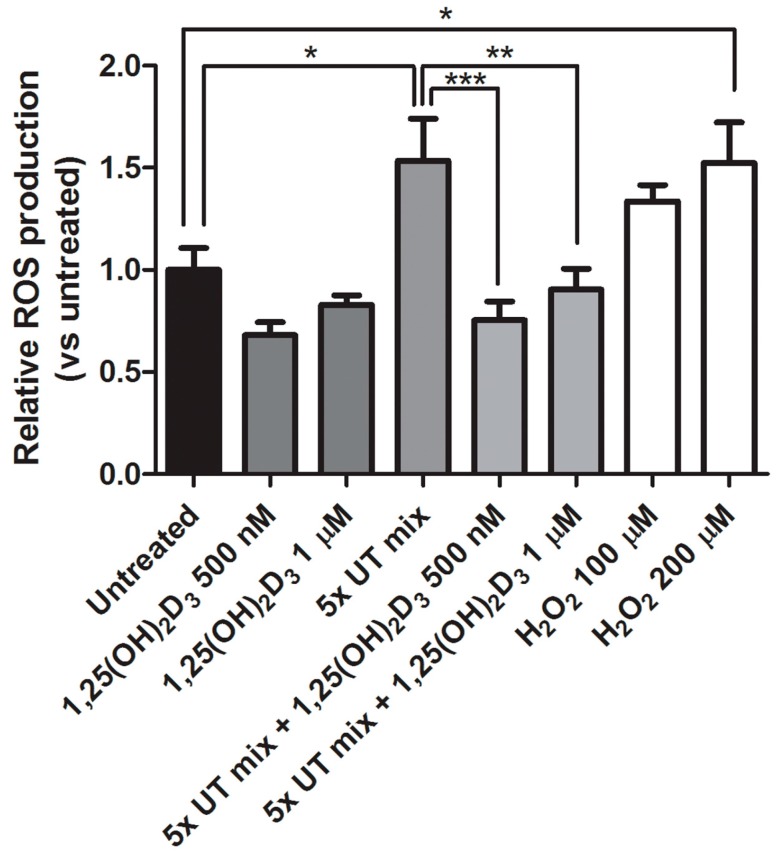
Figure 4.
Vitamin D effect on intracellular ROS production in ciPTEC-OAT1. Relative ROS production in ciPTEC-OAT1 after 2 h exposure to 1,25(OH)2D3 (500 nM and 1 μM), 5× UT mix, combination of the two at previous concentrations and H2O2 (100 μM and 200 μM). Three independent experiments were performed in duplicate. * p < 0.05, ** p < 0.01, *** p < 0.001 (One-way ANOVA followed by Dunnett’s multiple comparison test, using as a control either untreated sample or 5× UT mix, as indicated).

