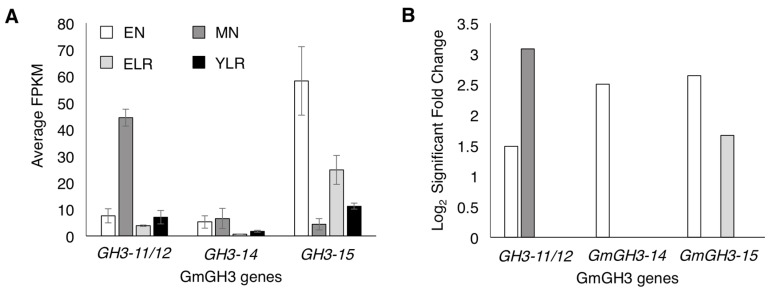
Figure 1.
Expression of GmGH3 genes in soybean root lateral organs. (A) Expression levels of GmGH3s in emerging nodule (EN), mature nodule (MN), emerging lateral root (ELR), and young lateral root (YLR) tissues. Data shown are average expression values from three biological replicates obtained using RNA-seq. Normalized gene expression levels based on RNA-seq read counts are shown in FPKM (fragments per kilobase of transcript per million mapped reads). Error bars indicate SD; (B) Enrichment of GmGH3 gene expression in the same four tissue types relative to adjacent root tissues. Data shown are statistically significant log2 fold change values vs. the respective control root segments from three biological replicates. See Table S1 for additional details.

