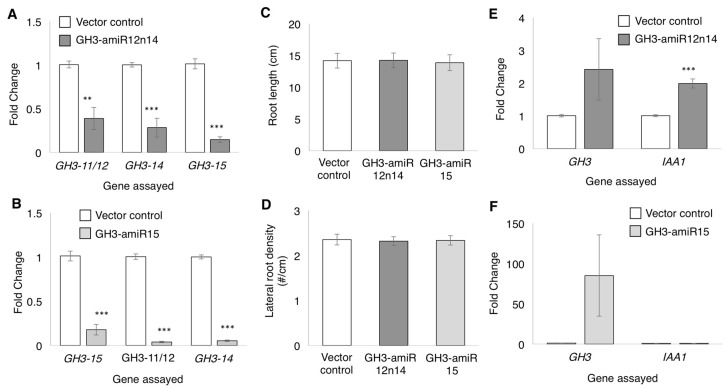
Figure 6.
Suppression of GmGH3 expression by artificial microRNAs. (A,B) Expression of target GmGH3 genes in roots expressing (A) GH3-amiR12n14 and (B) GH3-amiR15 relative to vector control roots; (C) Root length and (D) lateral root density of vector control roots and roots expressing GH3-amiRs. Data shown are averages (n = 21) and error bars indicate SEM. No significant difference observed using Student’s t-test; (E,F) Expression of auxin response marker genes GH3 and IAA1 in roots expressing (E) GH3-amiR12n14; and (F) GH3-amiR15, relative to vector control roots. Expression levels shown in (A,B,E,F) were assayed by RT-qPCR and normalized to that of Actin in each sample. Data shown are average relative expression values (fold change vs. vector control) from three biological replicates and error bars indicate the range of possible value based on SD between replicates. ** p < 0.01, *** p < 0.001, Wilcoxon-Mann-Whitney test.

