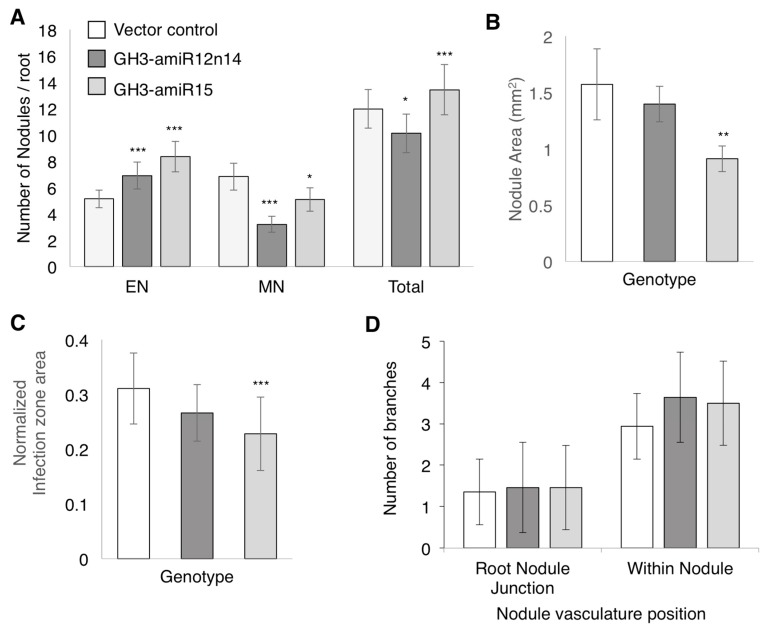
Figure 7.
Nodule numbers and morphology in GH3-amiR expressing soybean roots. (A) Numbers of emerging, mature, and total nodules in vector control, GH3-amiR12n14, and GH3-amiR15 expressing roots at 17 dpi. Data shown are the averages of at least 68 roots for each construct from three independent experiments. Error bars indicate SE. * p < 0.05, *** p < 0.001, Poisson distribution test; (B) Nodule area; and (C) normalized infection zone size of mature nodules from vector control, GH3-amiR12n14, and GH3-amiR15 expressing roots. Data shown are averages of at least 15 nodules each from three biological replicates. Error bars indicate SE. ** p < 0.01, *** p < 0.001, Wilcoxon-Mann-Whitney test; (D) Number of vasculature branches detectable at the root-nodule junction and within the nodule in transverse sections of mature nodules from vector control, GH3-amiR12n14, and GH3-amiR15 expressing roots. Data shown in C are averages of at least 15 nodules each from three biological replicates. Error bars indicate SE. Student’s t-test.

