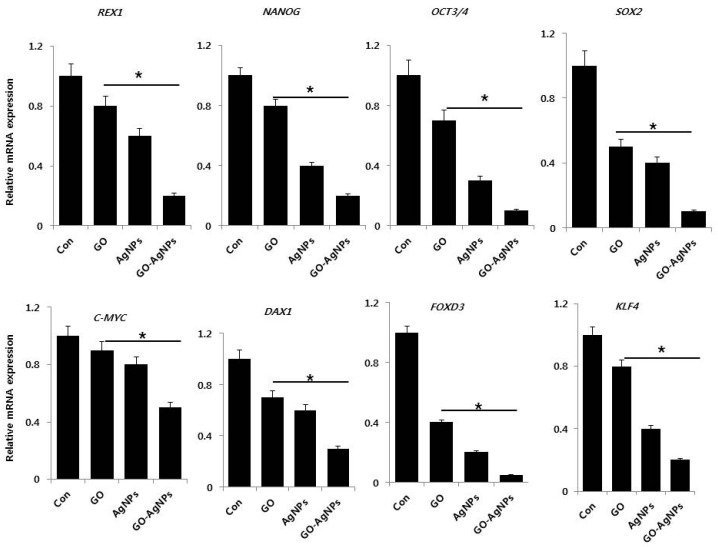
Figure 6.
Reverse transcription-quantitative polymerase chain reaction (RT-qPCR) analysis of expression of various stem cell markers. The expression pattern of various stem cell markers genes were analyzed by exposure of SH-SY5Y cells to GO (10 µg/mL), AgNPs (5 µg/mL) and GO-AgNPs (1.0 µg/mL) for 24 h. After 24 h treatment, expression fold level was determined as fold changes in reference to expression values against GAPDH. Results are expressed as fold changes. At least three independent experiments were performed for each sample. The results are expressed as the mean ± standard deviation of three independent experiments The treated groups showed statistically significant differences from the control group by the Student’s t-test (* p < 0.05).

