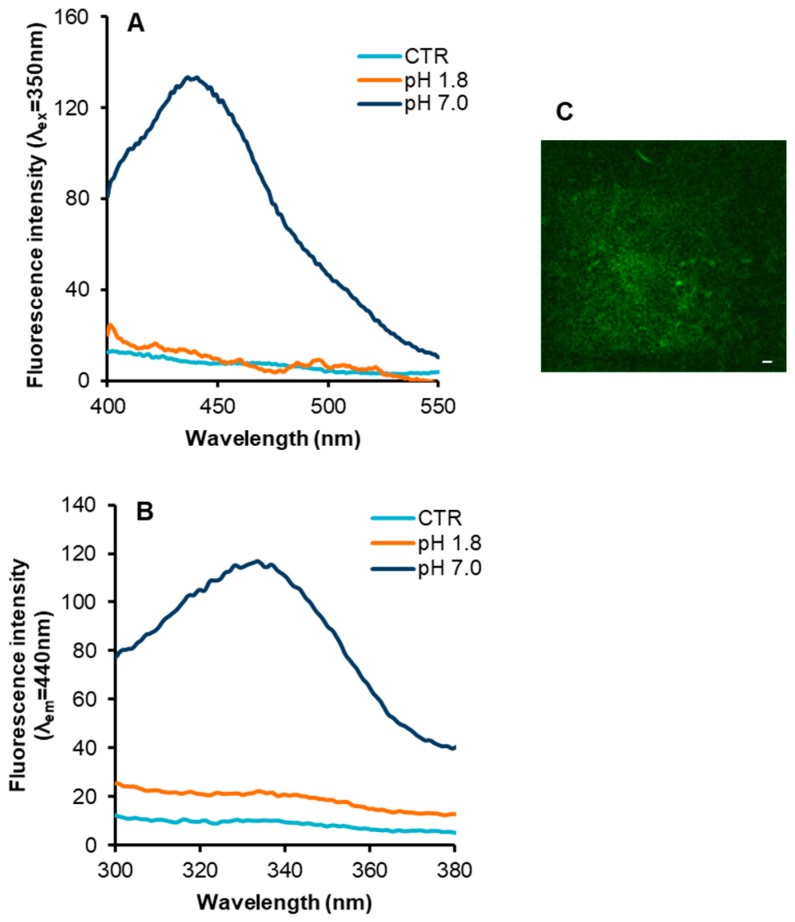
Figure 3.
Intrinsic fluorescence properties in insulin fibrils. Emission (panel A) and excitation spectra (panel B) of insulin fibrils formed at pH 7.0 and pH 1.8, in comparison with the protein in native conditions (CTR). (C) TPM image (λex = 750 nm) of insulin fibrils at pH 7.0 (scale bar 10 µm). Experimental details are described in the Materials and Methods section.

