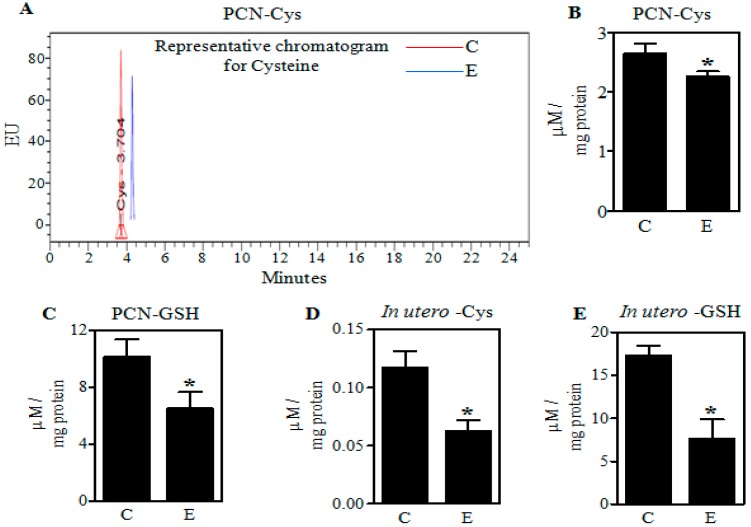
Figure 3.
Effect of ethanol on Cys and GSH levels in PCNs and fetal brain cortices. A representative high pressure liquid chromatography (HPLC) profile of Cys in Control (C) and ethanol (E)-treated PCNs (A); The concentration of Cys quantified using standards in PCNs (n = 4) (B); Quantification of GSH concentration in control and E-treated primary cerebral cortical neurons (PCNs) using standards as measured by HPLC (n = 4) (C); HPLC-based determination of Cys concentration in fetal brain cortices of binge alcohol-exposed pregnant rats (n = 7) (D); Fetal brain cortex GSH content following binge alcohol gestational exposure using HPLC (n = 4) (E). Values represent the mean ± SEM. * p < 0.05 was considered significant for ethanol alone.

