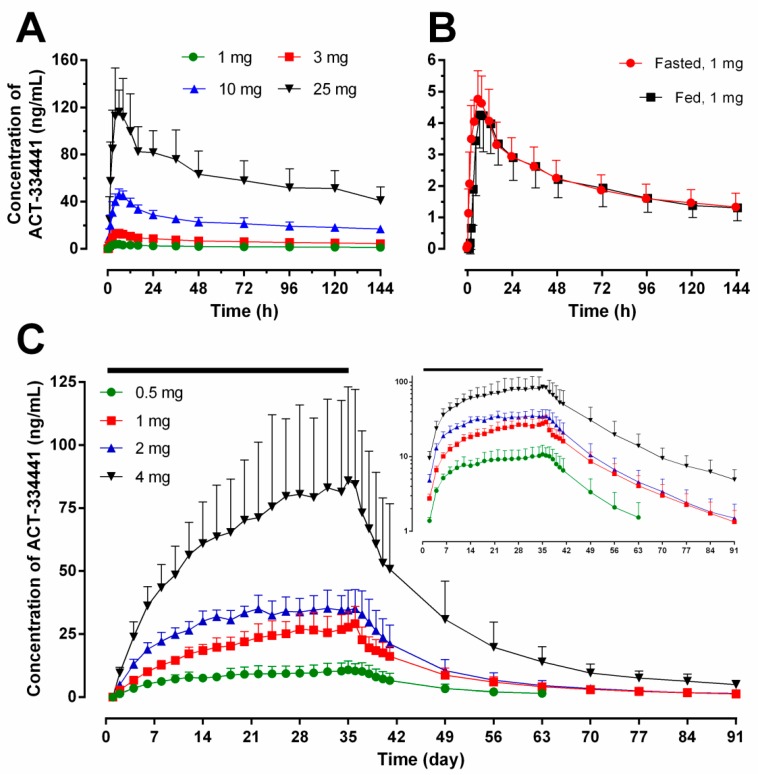
Figure 1.
Arithmetic mean (with standard deviation) plasma concentration-time profiles of cenerimod following single or multiple o.d. oral doses in healthy subjects. Panels (A,B) represent the concentration of cenerimod after single ascending doses (N = 6 per dose group) and single-dose administration in fasted versus fed conditions (1 mg, N = 8), respectively; Panel (C) depicts the concentration of cenerimod until the end-of-study (EOS) (N = 6 per dose group, the black bar represents the treatment duration of 35 days) on linear scale (semi-logarithmic scale shown as inset).

