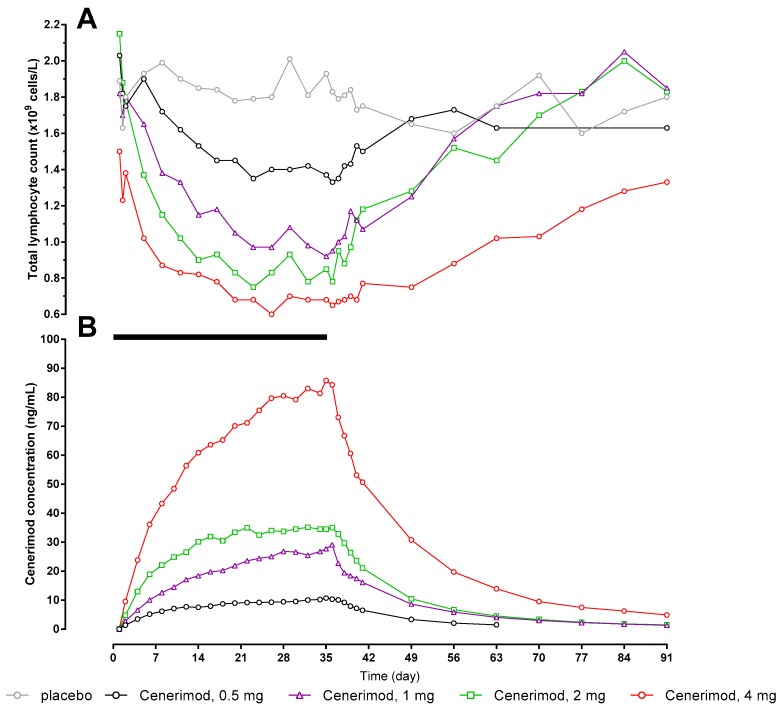
Figure 3.
Arithmetic mean total lymphocyte count (Panel (A)) and cenerimod concentration (Panel (B)) versus time profiles from 0 h to EOS after multiple-dose o.d. oral doses of cenerimod (Study 2) for 35 days (N = 6 per dose group, N = 8 for placebo group). The black bar represents the treatment duration. EOS: end-of-study.

