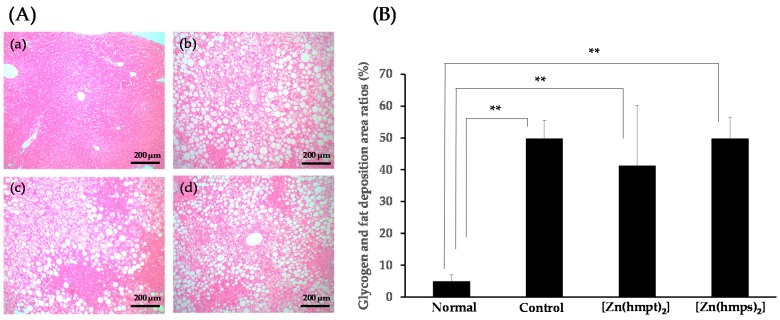
Figure 6.
(A) Hepatic morphology in 14-week-old normal (a); control (PEG-400 administered) (b); [Zn(hmpt)2]-treated (c); and [Zn(hmps)2]-treated mice (d). Hematoxylin and eosin staining, ×100 (scale bar = 200 μm); (B) Glycogen and fat deposition area ratios in the hepatic sectioned tissue of normal, control (PEG-400 administered), [Zn(hmpt)2]-treated, and [Zn(hmps)2]-treated mice. Data are expressed as the means ± SDs for 6–8 mice. Statistical analysis was performed using the Steel-Dwass test; significance: ** p < 0.01 vs. normal mice.

