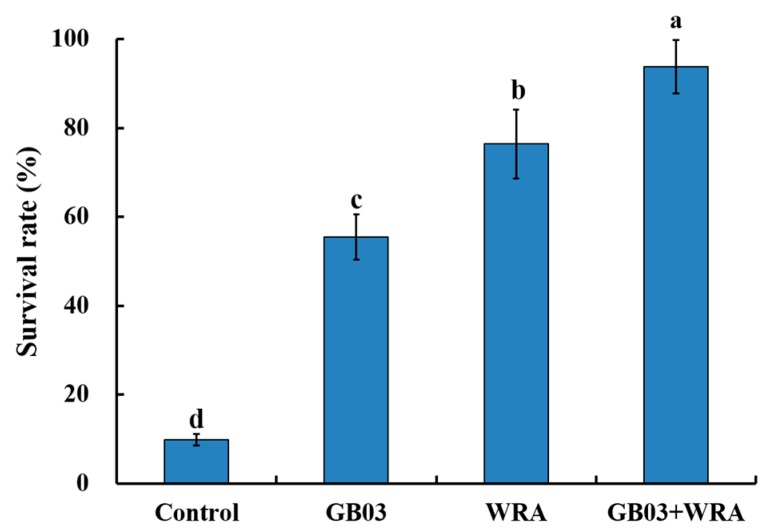
Figure 2.
The survival rate of ryegrass seedlings with 20 days natural drought and then seven days after rewatering. Values are means and bars indicate standard errors (SEs) (n = 12). Columns with different letters indicate significant differences among treatments at p < 0.05 (ANOVA and Duncan’s post-hoc multiple comparison test).

