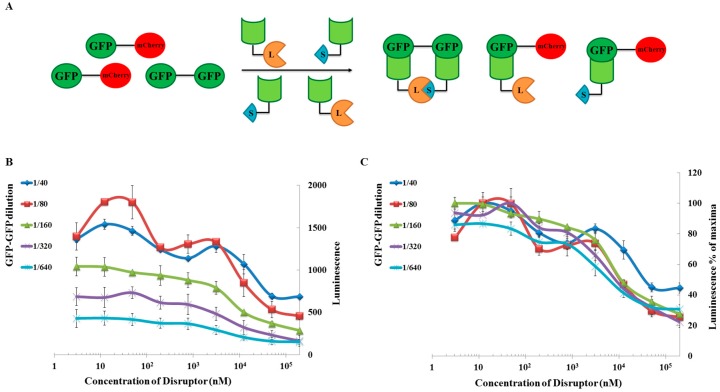
Figure 5.
Detection limit studies using a competition approach. (A): Schematic representation of the indirect approach that was used to study the detection limit of the split-luc assay. For the assay, along with the SLN bits and the target protein, we expressed the competitor in a Leishmania cell-free system, and this was used for our assays. The competitor was incubated with SLN bits allowing it bind to the nanobody before adding the target protein and the substrate; (B): Graphical representation of luminescence as a function of competitor concentration; (C): Normalized data-set from the data obtained for graph 5B. The data was normalized against the maximum luminescence obtained for each target concentration and plotted against the competitor concentration. The data-set for each target concentration seems to overlap, suggesting that the inhibition curves obtained were independent of target protein concentration.

