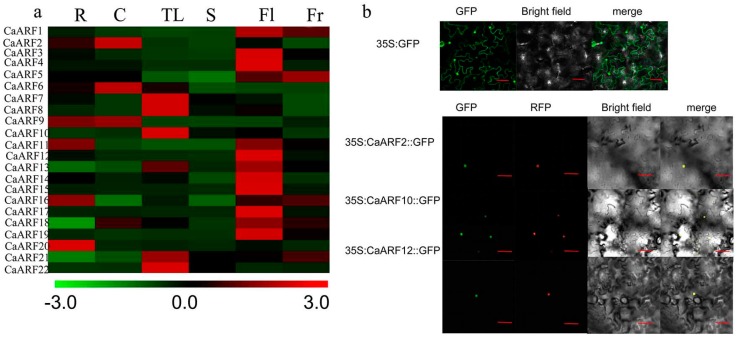
Figure 4.
Tissues-specific expressions analysis of CaARF genes and Subcellular localization of three selected CaARF proteins. (a) Expression patterns of CaARF genes in six tissues. R: roots; C: cotyledons; TL: true leaves; S: stems; Fl: flowers; Fr: fruits. Levels of different colours were shown on expression scale of each CaARF genes. The value of CaACTIN defines as 1000 and the relative mRNA level of individual genes was normalized with respect to the CaACTIN gene. Heat map was draw by MeV software was using the average log10 (expression value) (b) CaARFs and GFP fusion proteins were transiently expressed in tobacco epidermis cells under the CaMV35S promoter. From top to bottom: 35S:GFP, 35S:CaARF2::GFP, 35S:CaARF10::GFP, 35S:CaARF12::GFP. Left to right: GFP fluorescence, red fluorescence of nuclear marker (NSL-mCherry), bright-field, merged microscope images. Bar = 50 μm.

