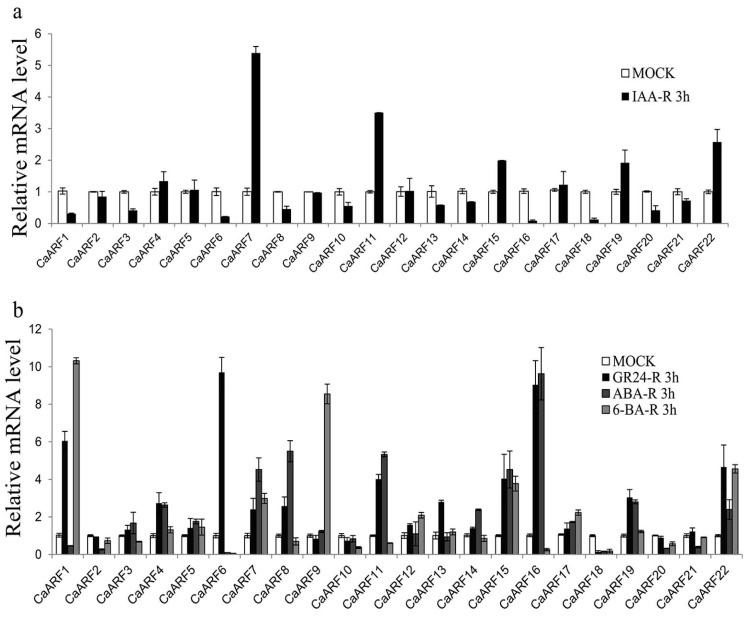
Figure 7.
qRT-PCR analysis of CaARF family genes in roots under various hormone treatments. (a) Expression patterns of CaARF family genes family genes under 10 μM IAA treatment for 3 h. (b) Expression profiles analysis of CaARF family genes under 10 μM GR24, 1 μM ABA, 1 μM 6-BA for 3 h, respectively. Error bars represent standard deviations from 3 biological replicates.

