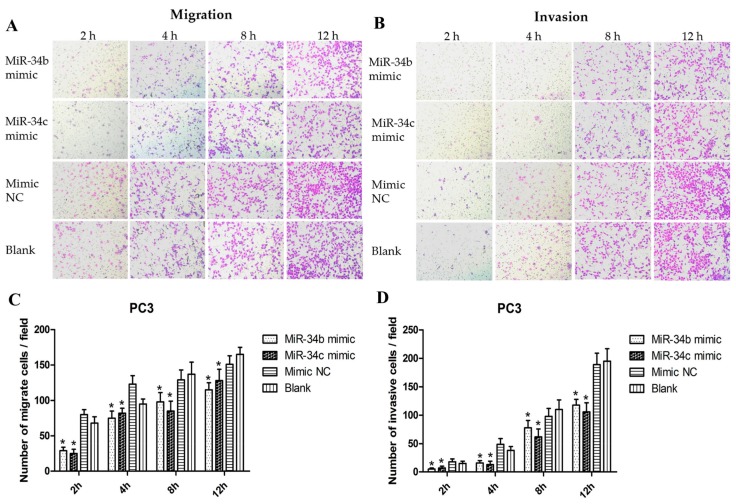
Figure 7.
The capacity of migration and invasion of PC3 cells after transfection with miR-34b/c at 2, 4, 8, 12 h respectively. (A,B) Representative images of the invasion and migration of PC3 cells taken by an inverted microscope (20× objective); (C,D) Quantitative analysis of cell migration and invasion. * p < 0.05 vs. mimic NC or blank group (basal migration without transfection). Per condition, three independent experiments were performed.

