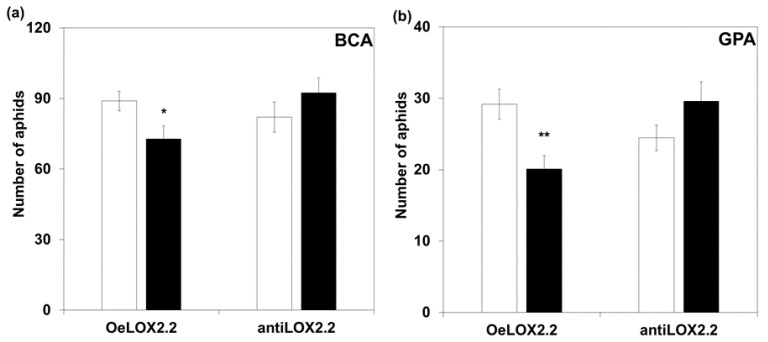
Figure 3.
Aphid numbers on control and transgenic lines, five days after infestation with twenty adult apterous aphids. (a) Numbers of bird cherry-oat aphid (BCA), (b) numbers of green peach aphid (GPA). White and black bars indicate, respectively, control and transgenic lines. Bars indicate the average (±SE). n = 12 for BCA and n = 22 for GPA. Asterisks indicate significant differences after aphid infestation between control and transgenic plants (t-test, * p ≤ 0.05; ** p ≤ 0.01).

