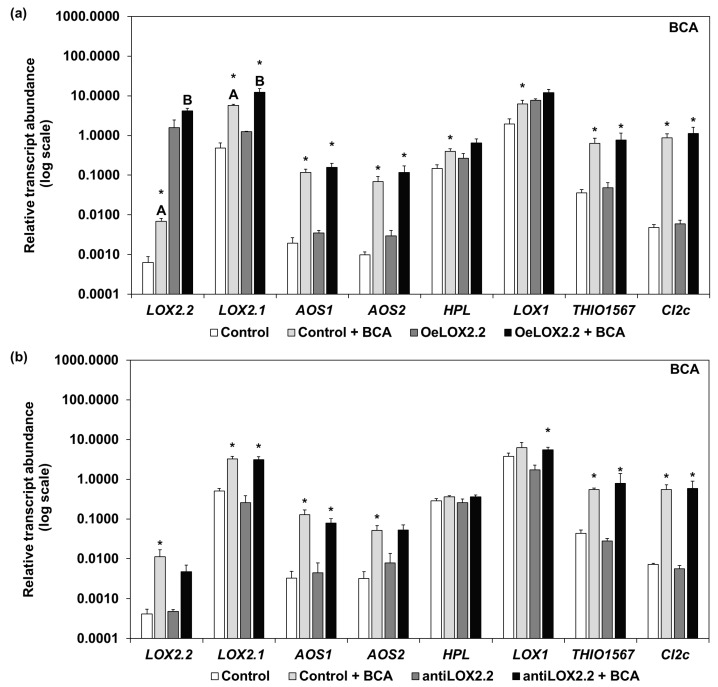
Figure 4.
Relative transcript abundance in control and transgenic lines without aphids and infested with BCA for five days. (a) Control and OeLOX2.2 plants, (b) control and antiLOX2.2 plants. White and light grey bars represent control plants, with and without aphids; dark grey and black bars represent transgenic lines with and without aphids. The transcript abundance is relative to reference genes Hsp70 and Tubulin (±SE). Different letters indicate significant differences between the infested lines, asterisks indicate significant differences for the same line with and without BCA (* p < 0.05 Mann-Whitney test; n = 3 for plants without aphids, n = 4 for infested plants; three technical replicates).

