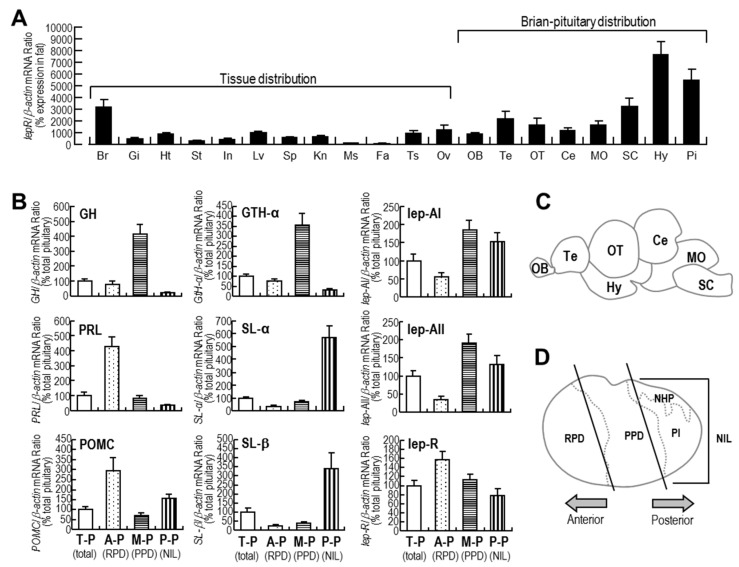
Figure 2.
(A) Expression profiles of goldfish lepR in various tissues and brain regions, including brain (Br), gill (Gi), heart (Ht), intestine (In), liver (Lv), spleen (Sp), kidney (Kn), muscle (Ms), Fat (Fa), testis (Ts), ovary (Ov), the olfactory bulb (OB), telencephalon (Te), optic tectum (OT), cerebellum (Ce), medulla oblongata (MO), spinal cord (SC), hypothalamus (Hy), and pituitary (Pi), as assessed by real-time quantitative (qPCR); (B) Expression pattern of major hormones, including GH, PRL, POMC, GTH-α, SL-α, SL-β, leptin-AI, leptin-AII and lepR, in different regions of pituitary assessed by qPCR. T-P indicates total pituitary; A-P indicates anterior pituitary, corresponding to rostral pars distalis (RPD) in mammalian pituitary; M-P indicates medium pituitary, corresponding to proximal pars distalis (PPD) in mammalian pituitary; P-P indicates posterior pituitary corresponding to neurointermediate lobe (NIL), consisting of neurohypophysis (NHP) and pars intermedia (PI) in mammalian pituitary; (C) diagram showing the goldfish brain regions; (D) diagram showing different parts of the goldfish pituitary. In these studies, data are expressed as the mean ± SE (n = 3 for testis and ovary, and n = 6 for other tissue and pituitary samples).

