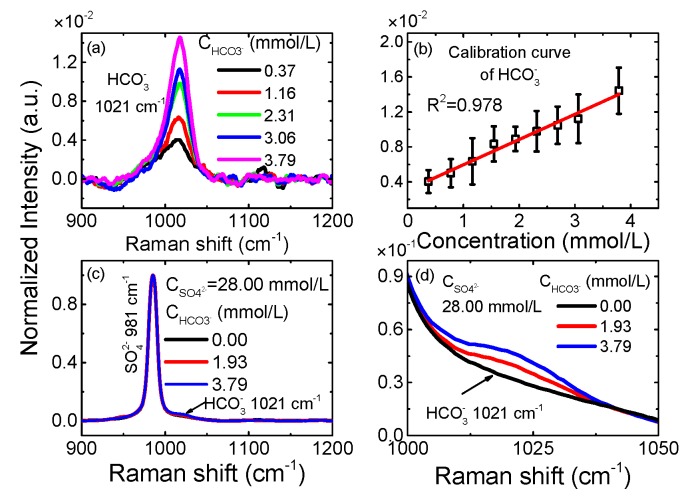
Figure 3.
The detection ability of the NC-CERS system for HCO3−. (a) The spectra of 5 NaHCO3 aqueous solutions with different concentrations. (b) The linear relationship between concentrations and peak intensities of the HCO3− signal. (c) The Raman spectra of three mixed solutions which contains fixed NaSO4 concentration (28.00 mmol/L) and different NaHCO3 concentrations. (d) The detailed spectra (1000–1050 cm−1) of mixed solutions.

