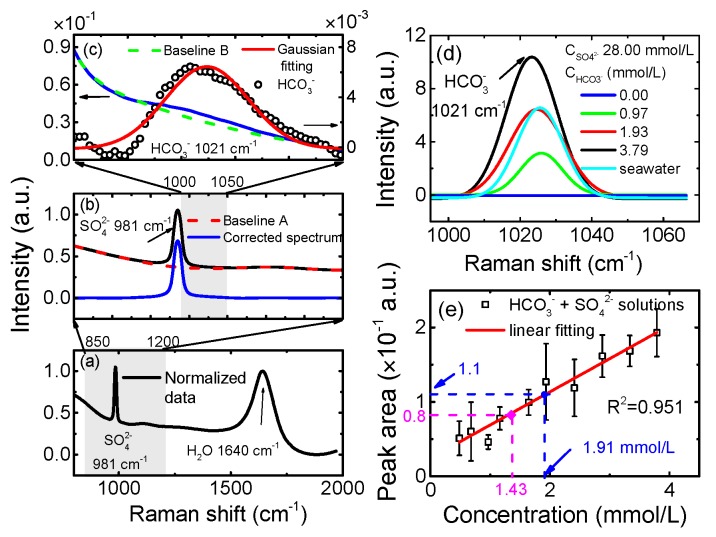
Figure 4.
The signal extraction method for quantitative analysis of HCO3−. (a) The normalized spectrum of mixed solution with 28.00 mmol/L Na2SO4 and 1.93 mmol/L NaHCO3. (b) Baseline correction. The red dotted line represents the baseline curve fitted by a polynomial function, and the blue line is the baseline corrected curve. (c) The signal extraction method for HCO3−. The green dotted line represents the baseline B fitted by a double exponential function. The extracted signal is shown as black circle dots and fitted by using a Gaussian function (red line). (d) Fitted HCO3− Raman signals of 1000 m depth seawater and four mixed solutions with fixed 28.00 mmol/L Na2SO4 and different concentrations of NaHCO3. (e) The calibration curve of HCO3−. The pink point is the result of a blind sample, and the blue point is the result of a seawater sample.

