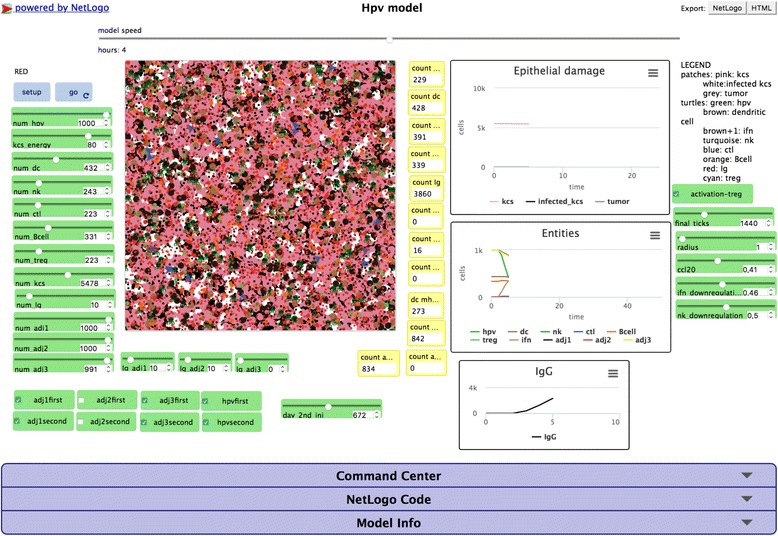
Fig. 2.

Screenshot of the web interface of the Hpv model. The HPV NetLogo web interface. The two cyan buttons “setup” and “go” allow to set-up and start the simulation. The green boxes contain the sliders and the check buttons that allow to modify the simulation parameters. The central box shows the simulation space with the involved entities. The yellow boxes allow to visualize the actual number of entities as the simulation advances. The three real-time graphs show the Epithelial damage, entities, and IgG levels. On the bottom, the three slidedown windows allow to interact and modify the model behavior, as command center window that allows to put real-time commands, or the NetLogo code window that allows to show, modify and recompile the code
