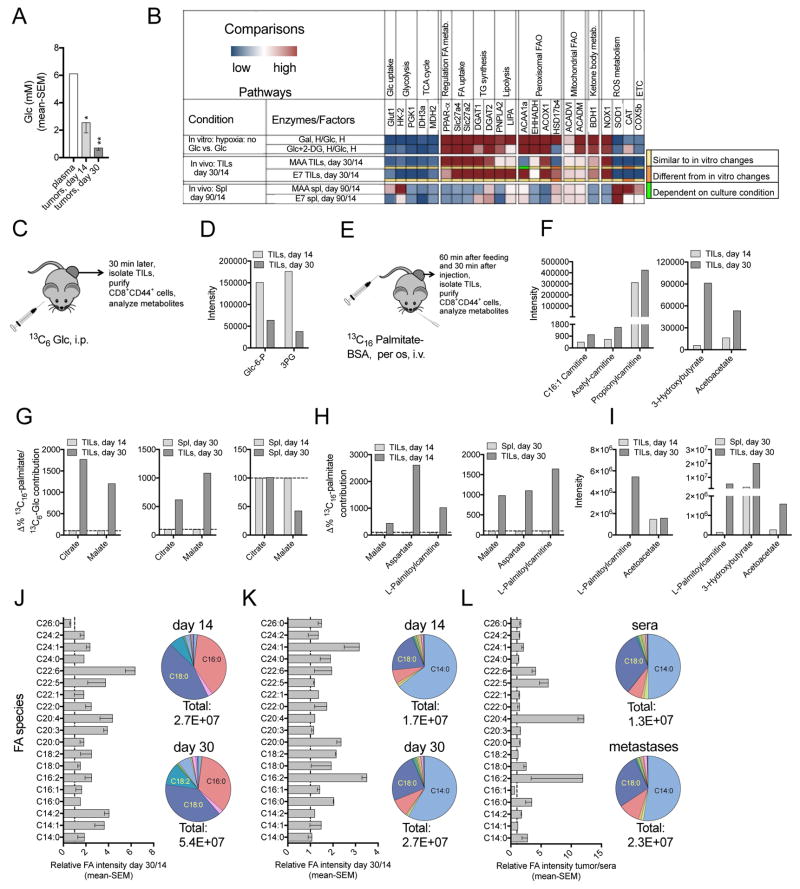
Figure 4. Limited access to Glc and O2 forces CD8+ TILs to enhance FA catabolism.
(A–G) Vaccine model. (A) Glc concentrations in plasma, early and late stage B16BrafV600E tumors (n=3). (B) Relative transcript levels: Upper: CD8+ T cells in Gal- or Glc+2-DG- vs. Glc-medium under hypoxia. Middle: specific CD8+ TILs from day 30 vs. 14 tumors. Lower: specific CD8+ T harvested from day 90 vs. 14 Spl (n=3). Color code below 3rd and 4th row: comparisons between in vitro and in vivo samples. (C) Experimental set-up: 13C6-Glc in vivo tracing. (D) Intensity of glycolysis metabolites in CD44+CD8+ TILs. (E) Experimental set-up: 13C16-palmitate in vivo tracing. (F) Intensity of FA metabolites in CD44+CD8+ TILs. (G) Relative contribution of 13C6-Glc- and 13C16- palmitate-derived carbons to citrate and malate, calculated by dividing labeling carbon numbers from 13C16-palmitate by the numbers from 13C6-Glc. Data of CD44+CD8+ T cells from day 30 tumors are normalized to those from day 14 tumors (left) or day 30 Spl (middle); Spl data: day 30 normalized to 14 (right). (D, F, G) n=2–3, pooled from ~30 mice/sample. (H–I) OT-1 transfer model. (H) Normalized contribution of 13C16-palmitate to TCA cycle metabolites and L-palmitoylcarnitine in CD44+CD8+ TILs from day 30 vs. 14 tumors or day 30 Spl. (I) Intensities of FA metabolites. (H–I) n=2, pooled from ~20 mice/sample. (D, F, G–I) Data show as mean values. (J–L) Bar graphs: Relative intensity of free FA species in tumor interstitial fluid, dashed lines show ratio of 1. Pie charts: Abundance of different FA species. Total numbers: combined FA intensity. (J–K) day 30 over 14 B16BrafV600E tumors (J, n=3) or PDX melanomas (K, n = 5). (L) Human melanoma metastases vs. human sera (n = 4). (D, F, G–L) Representative of two assays. (A, J–L) mean - SEM. See also Figures S4, S5.

