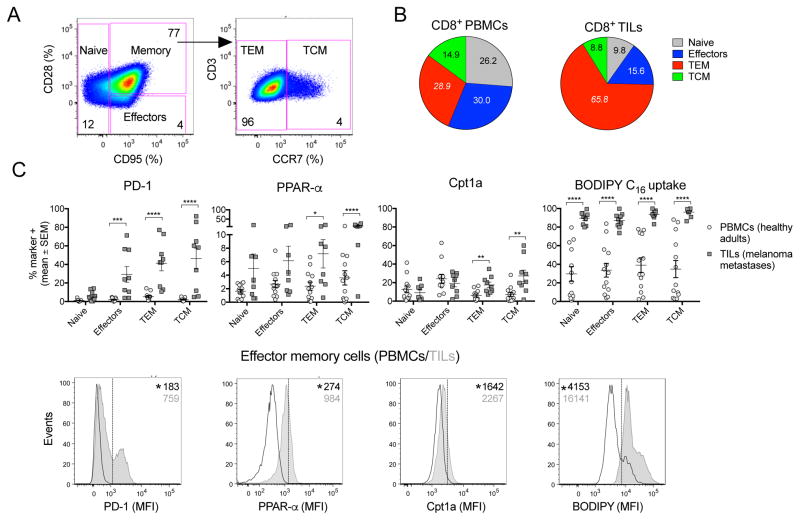
Figure 5. Metabolism of T cells in human samples.
(A) Gating strategy for human CD8+ T cells subsets. Numbers show % of cells in each subset. (B) Pie charts show distribution of CD8+ T cell subsets within CD8+ T cells isolated from blood of healthy donors (n=14) or metastatic tumors of melanoma patients (n=9). p<0.0001 for differences in numbers of TEM cells normalized to 106 live CD8+ T cells. Numbers within pie charts show mean percentages. (C) Upper: % of cells positive for PD-1, Cpt1a, PPAR-α and FA uptake (BODIPY C16). Data show comparison for CD8+ T cell subsets isolated from blood vs. tumors. Lower: Representative histograms comparing markers of CD8+ TEM from blood vs. tumors. Data show mean - SEM.

