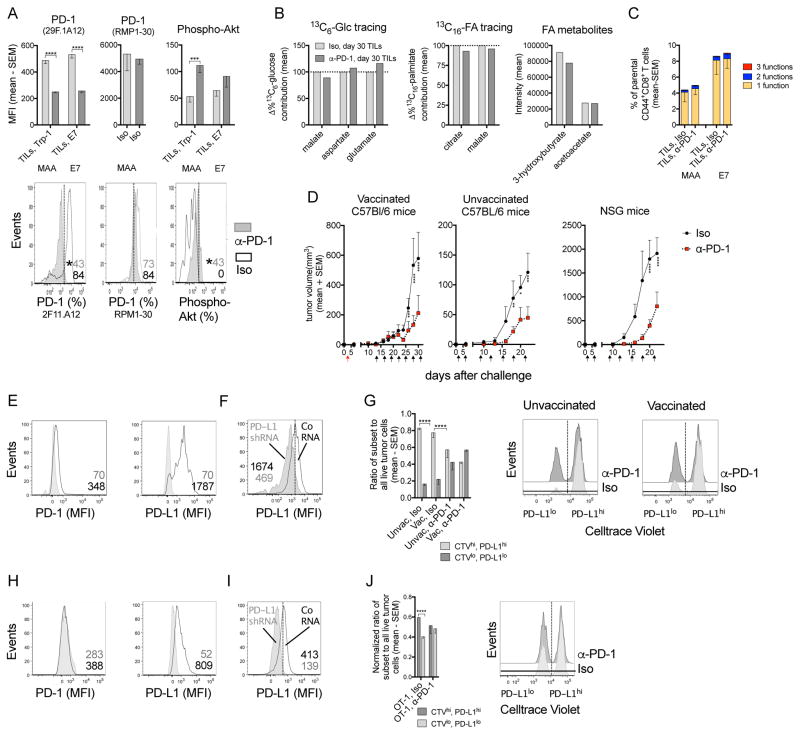
Figure 6. Metabolism and effector functions of CD8+ TILs are independent of PD-1.
(A) MFI of PD-1 tested with PD-1 Ab clone 29F.1A12 (same clone as α-PD-1 treatment Ab) or RMP1-30 and Phospho-Akt on/in specific CD8+ TILs from day 30 tumors (n=5–7). Iso: isotype control mAb. Lower: Flow plots for MAA-specific TILs. (B) Normalized 13C6-Glc or 13C16-palmitate contribution to TCA cycle metabolites and the intensity of ketone bodies in CD44+CD8+ T cells from day 30 tumors comparing α-PD-1- to Iso-treated mice. n=2 or 3, pooled from 25 mice/sample, shown as mean values. (C) % specific CD8+ TILs from day 30 tumors producing 3, 2 or 1 of the 3 tested functions (Iso: n=11; α-PD-1: n=15; data pooled from two assays). (D) B16BrafV600E tumor growth in mice that received Iso or α-PD-1 (unvaccinated: n=5; vaccinated: n=13; NSG: n=4). Arrows: red (vaccine); black (Ab treatment). (E) PD-1 and PD-L1 on B16BrafV600E tumor cells grown in vivo. Iso (grey), specific Ab (open). (F) PD-L1 KD in B16BrafV600E cells. (G) In vivo assay comparing survival of PD-L1hiCTVhi vs. PD-L1loCTVlo tumor cells in vaccinated or unvaccinated mice treated with Iso or α-PD-1 mAb. Bar graph: ratio of recovered live PD-L1hi over PD-L1lo B16BrafV600E cells (n=5). Right: histograms. (H) PD-1 and PD-L1 on B16OVA tumor cells grown in vivo. (I) PD-L1 KD in B16OVA cells. (J) Normalized survival of PD-L1hiCTVhi vs. PD-L1loCTVlo B16OVA cells in Iso or α-PD-1-treated mice that were transferred with activated OT-1 cells and representative histograms (n=5). (A, C, D, G, J) Data show mean with SEM (representative of 2 experiments). See also Figures S6.

