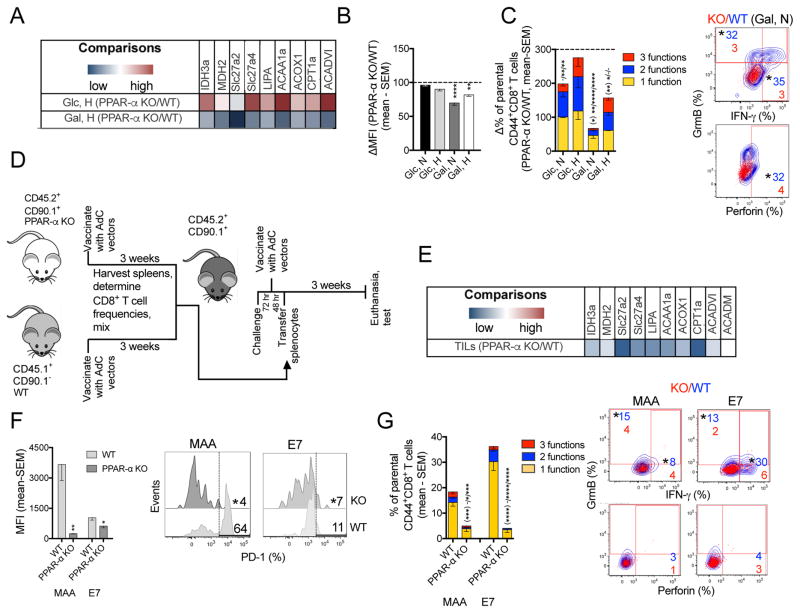
Figure 8. Inhibiting FA catabolism impairs CD8+ T functions while decreasing PD-1 expression.
(A) Transcript levels comparing CD8+ T cells from PPAR-α KO and WT mice stimulated in Glc- or Gal-medium under hypoxia (n=4). (B) Normalized MFIs for PD-1 on PPAR-α KO vs. WT activated CD8+ T cells cultured under different conditions (n=4–5). (C) Left: Normalized % PPAR-α KO vs. WT CD8+ T cells producing 3, 2, or 1 of the 3 tested functions (n=5). Right: Overlays of WT (blue) vs. PPAR-α KO (red) CD8+ T cells cultured in Gal-medium under normoxia. (D) Experimental design. (E) Comparison of transcript levels in CD44+CD8+ TILs from PPAR-α KO vs. WT donors (n=3 mice/group). (F) MFI of PD-1 on WT and PPAR-α KO donor CD8+ TILs with histograms. (G) Left: % donor-derived specific CD8+ TILs from the two groups producing 3, 2, or 1 of the 3 tested functions; Right: Overlays of factor-producing WT (blue) vs. PPAR-α (red) donor-derived TILs. (F, G) n=6/group. Data represent 2 assays, shown as mean - SEM. See also Figure S8.

