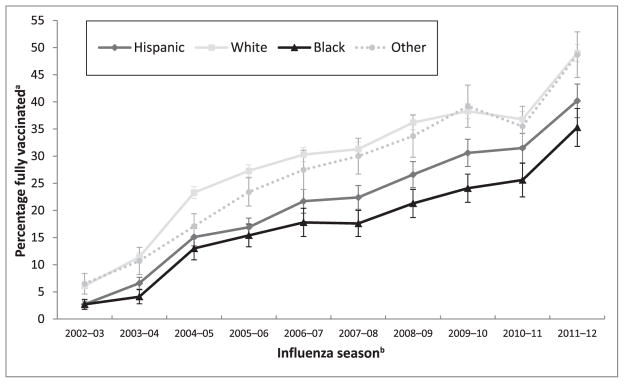
FIGURE 2.
Full influenza vaccination coverage among children aged 6 to 23 months by influenza season and racial/ethnic group, NIS, provider report, United States, 2002–2003 through 2012–2013 influenza seasons. aEstimates obtained using Kaplan-Meier survival analysis methods and reported with confidence interval half-widths. Estimates for the 2009–2010 season include only the seasonal influenza vaccine and exclude the 2009 H1N1 vaccine. bStatistically significant (P < .05) differences between groups as well as the direction of the differences are as follows: 2002–2003: H < W; H < O; B < W; B < O; 2003–2004: H < W; H < O; B < H; B < W; B < O. 2004–2005: H < W; B < W; O < W; B < O; 2005–2006: H < W; H < O; B < W; B < O; O < W; 2006–2007: H<W; B < H; H < O; B < W; B < O; 2007–2008: H < W; B < H; H < O; B < W; B < O; 2008–2009: H < W; B < H; H < O; B < W; B < O; 2009–2010: H < W; B < H; H < O; B<W; B < O; 2011–2012: H < W; B < H; B < W; W < O; B < O; 2012–2013: H < W; B < H; H < O; B < W; B < O, where H, Hispanic; W, white only, non-Hispanic; B, black only, non-Hispanic; O, other or multiple race, non-Hispanic. All other pairwise comparisons not noted were not statistically significant.

