
Figure 1. Persistent accumulation of CD163+ macrophages in ileum of SIV progressors but not controllers.
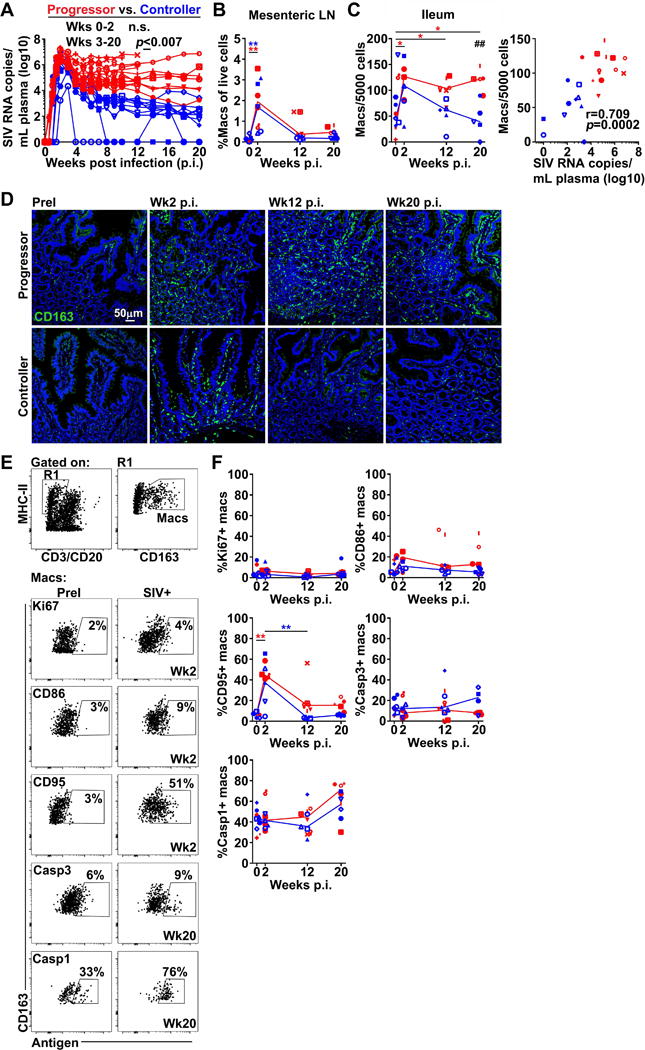
(A) Longitudinal viral RNA burden in plasma. Red depicts macaques with week 8 viral loads >104 RNA copies/mL (SIV progressors) and blue depicts macaques with week 8 viral loads <104 RNA copies/mL (SIV controllers). (B) The proportion of CD163+ macrophages in mesenteric LNs as determined by flow cytometry. (C) (Left) The frequency of CD163+ macrophages in sections of ileum enumerated using ImageJ and MetaMorph software. (Right) Correlation between the frequency of gut macrophages and plasma viral loads at weeks 12 and 20. (D) Representative immunofluorescence of sections of ileum from macaques prior to infection and at weeks 2, 12, and 20 post-infection stained with Ab to CD163 to identify macrophages. Original magnification = 200×. (E) (Top) Representative flow cytometric analysis of ileum single-cell suspensions showing gating strategy to define CD163+ macrophages. (Bottom) Representative flow cytometric analysis for Ki67, CD86, CD95, active caspase-3, and active caspase-1 on CD163+ macrophages in ileum before and after SIV infection. (F) The proportion of CD163+ macrophages expressing Ki67, CD86, CD95, active caspase-3, or active caspase-1 in ileum. Horizontal lines in (B), (C), and (F) represent medians. # signifies cross-sectional differences between progressors and controllers and * signifies longitudinal differences within the same groups. For (A) statistical comparisons were done using a two-tailed nonparametric Mann-Whitney U test. For (B), (C), and (F) statistical comparisons were done using a regular two-way ANOVA followed by Sidak’s post test (#) or nonparametric one-way ANOVA followed by Dunn’s post test (*). Correlations in (C) were determined using a two-tailed nonparametric Spearman rank test. */# p < 0.05; **/## p < 0.01; ***/### p < 0.001.