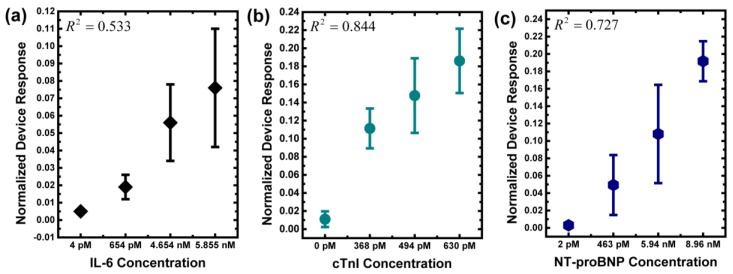
Figure 4.
Experimental results of the three biomarkers in human serums. (a) IL-6; (b) cTnI; (c) NT-proBNP. In these plots, the x-axis represents the result measured by ELISA, and the y-axis represents the result measured by CMOS biosensors (n = 3). It should be noted that, to make the plot directly comparable to the clinical-sample ELISA read-out, the x-axis is not to scale.

