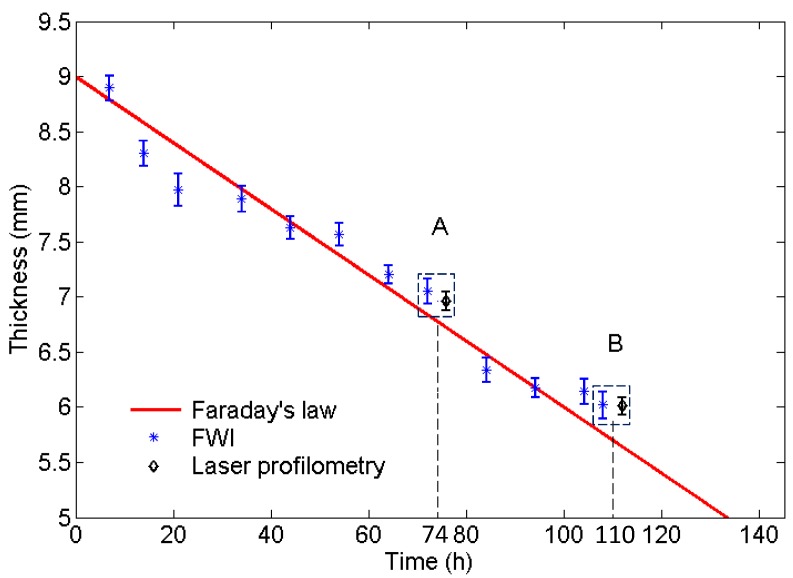
Figure 6.
The comparison of the average reconstructed thickness of the defect obtained by full waveform inversion (FWI) at 60 kHz and predictions by Faraday’s law in different corrosion periods of a mild steel plate. The upper and lower limits of measured thickness of defect A and B at corrosion time of 74 and 110 h obtained by FWI and laser profilometry are shown in the rectangular boxes, respectively. The results of laser profilometry will be explained in Section 5.2.

