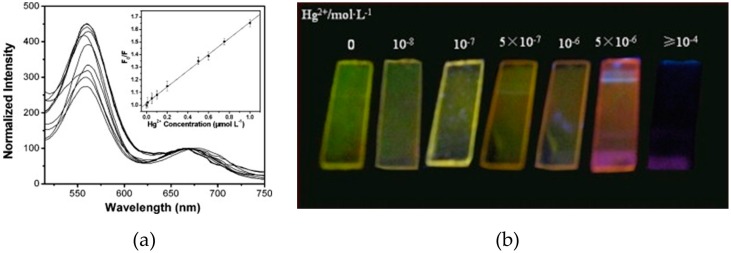
Figure 9.
(a) Luminescence spectra of the bi-color film under exposure to different Hg2+ concentrations: 0 μM, 0.01 μM, 0.05 μM, 0.1 μM, 0.2 μM, 0.5 μM, 0.6 μM, 0.75 μM, and 1 μM. The inset shows the Stern–Volmer plot of the sensor; (b) Colors of the sensing films under exposure to different Hg2+ concentrations: 0 μM, 0.01 μM, 0.1 μM, 0.5 μM, 1 μM, 1.5 μM, and higher than 100 μM. Reprinted from [107] with permission from Elsevier.

