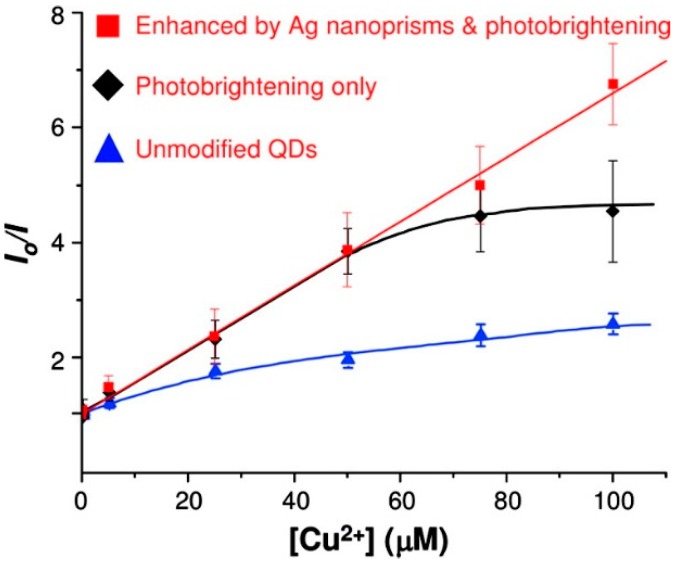
Figure 11.
Stern−Volmer plot for the quenching of CdSe PL by Cu2+. The solid red squares (□), black diamonds (⧫), and blue triangles (▲) denote the CdSe QDs enhanced by both Ag nanoprisms and photobrightening, the photobrightened QDs, and the unmodified QDs, respectively. Note: the blue and black lines are added as a guide using fits to a third-order polynomial. The red line is a linear fit to the data. Reprinted from [109] with permission from Elsevier.

