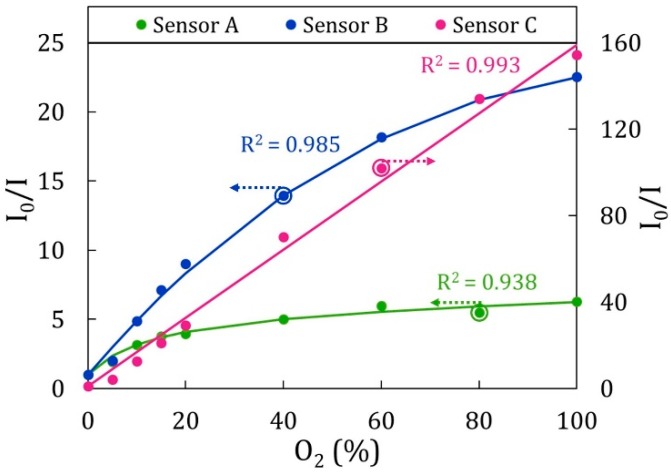
Figure 13.
Calibration curves of (PDDA/Pt-TFPPSDS)10 (Sensor A), (PEI/Pt-TFPPSDS)10 (Sensor B), and (PAH/Pt-TFPPSDS)10 (Sensor C). Stern–Volmer plots of Sensors A and B are adjusted on the left axis, whereas that of Sensor C is adjusted on the right axis. Reprinted from [49] with permission from Elsevier.

