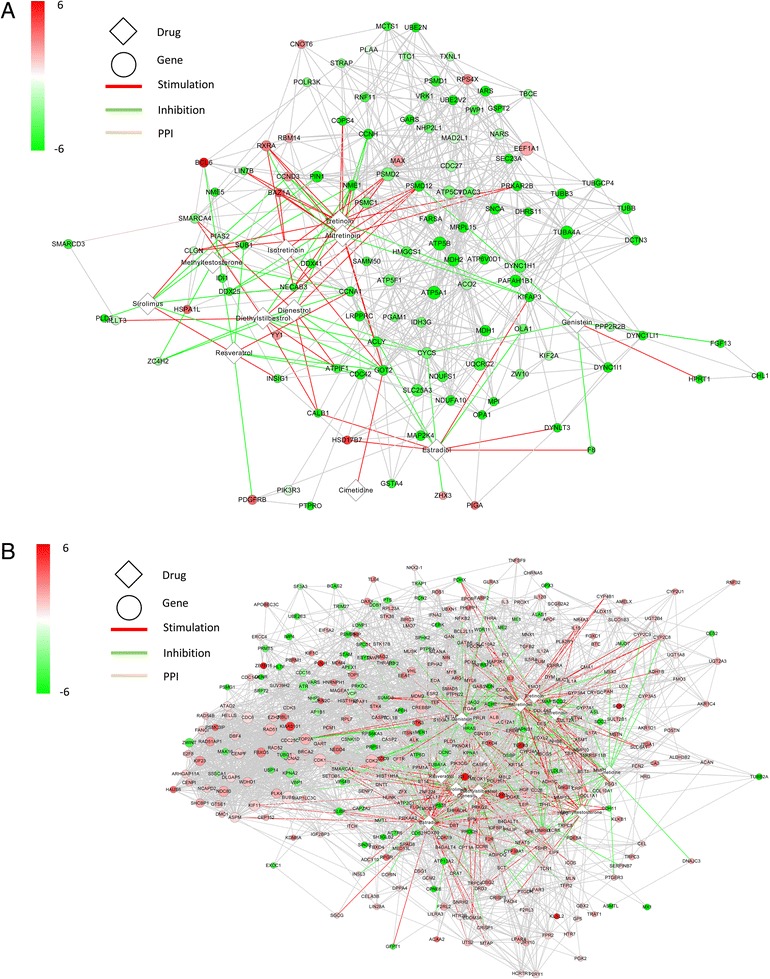
Fig. 10.

The extended modular drug-target network for the Br module (a) and the T module (b). The diamond nodes are drugs; circles are genes. The color of the nodes varies from green to red and indicates down-regulation or up-regulation situation of disordered genes, respectively. The color of the edges stands for the type of action. Red edges mean stimulation, green edges mean inhibition and gray edges means Protein-Protein Interactions. The node size represents the RP-score which indicates the relevance of the gene in the module calculated in Method
