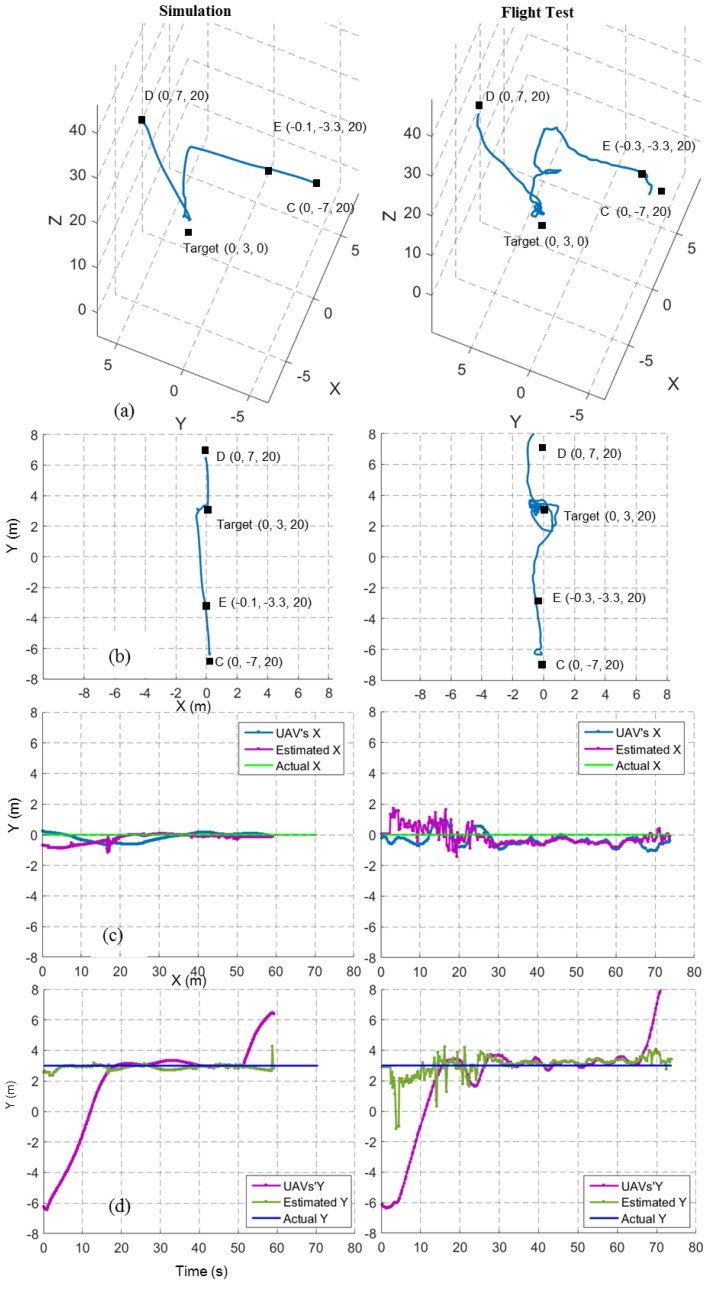
Figure 12.
Flight trajectories from a 20 m simulated and a real target finding and hovering missions. Left column shows simulated results and the right column shows field test results. (a) 3D View; (b) top view; (c) X coordinates of UAV position, estimated target position and real target position; and (d) Y coordinates of UAV position, estimated target position and real target position.

