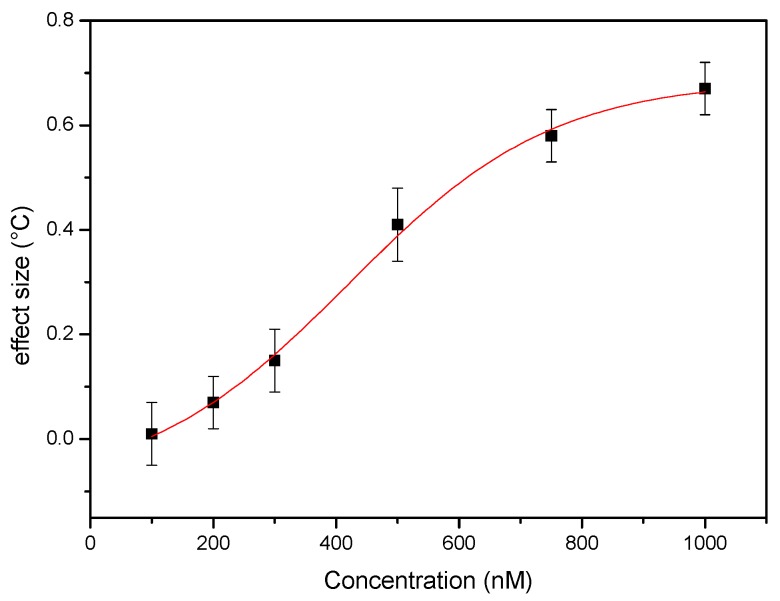
Figure 7.
Dose-response curve obtained by analyzing the response of single shot devices to whole blood samples spike with increasing concentrations of serotonin. The absolute change in the differential signal is presented in function of the spiking concentration. The red curve represents an allometric dose-response curve (R2 = 0.996). These data indicate that it is possible to qualitatively detect fluctuations in the concentration of serotonin in whole blood samples.

