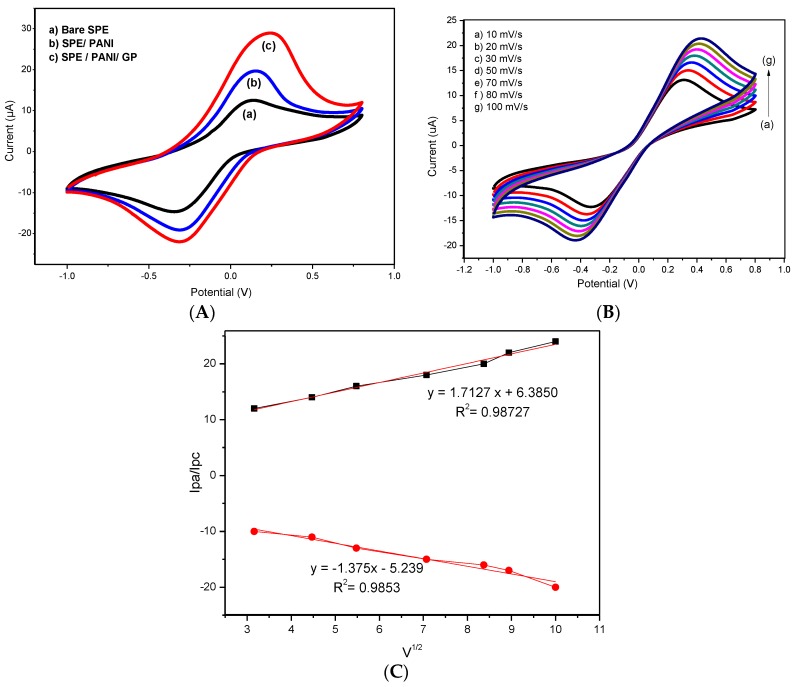
Figure 8.
(A) Cyclic voltammograms of (a) bare SPCE (b) SPCE/PANI (c) SPCE/PANI/GP recorded in 5.0 mM Fe(CN)63−/4− solution containing 0.1 M KCl at 100 mV·s−1; (B) Cyclic voltammograms of PANI/GP at different scan rates (10–100 mV/s) in 5.0 mM Fe(CN)63−/4− and 0.1 M KCl at 100 mV·s−1 and (C) Plot of anodic and cathodic peak current (Ip) vs. square root of scan rate (V1/2).

