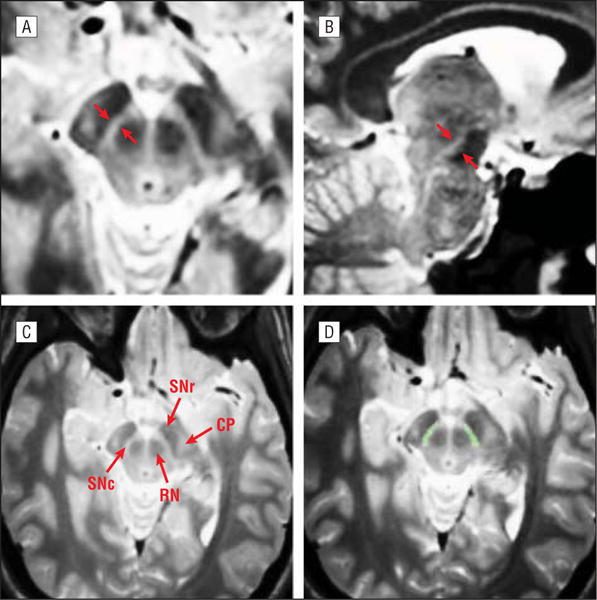
Figure 1.

Control subject. A and B, Representative axial (A) and sagittal (B) views of the midbrain of a control subject’s multispectral weighted mean. The red arrows in A and B indicate the substantia nigra. C, Shown are the substantia nigra pars compacta (SNc), substantia nigra pars reticulata (SNr), red nucleus (RN), and cerebral peduncles (CP). D, Example of the same control subject’s manually delimited label of the SNc (green).
