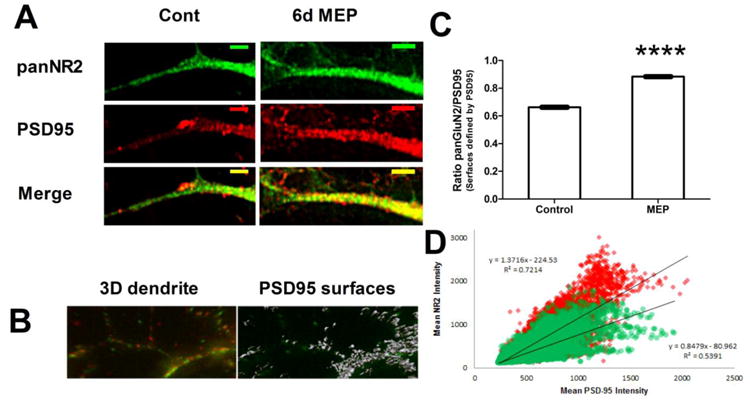
Figure 2. MEP augments synaptically-localized NMDARs.

A) Representative dendrite of cerebellar cultures (10DIV) treated for 6d with media containing 30mM ethanol (MEP) or vehicle (control) as described. Cultures were fixed and stained with the indicated primary antibodies, and appropriate fluorophore-conjugated secondary antibodies. Images were collected on a Delta Vision deconvolution microscope and a representative z-plane is shown (scale bar = 5μm). B) Representative 3D image generated with Imaris 3.1 showing PSD-95 (red) and pan NR2 (green). Gray surfaces represent areas defined by PSD-95 staining and identified by Imaris algorithm for quantification. C) Arbitrary intensities were determined for each surface using Imaris, and the ratio of NR2/PSD-95 was calculated and plotted as mean ± sem. At least 20 neurons were imaged per group. ****p<0.0001 vs. control. D) Scatter plot of surfaces identified in C, with regression data showing increased slope of MEP-treated putative synapses. Red diamond=MEP, green circles = control.
