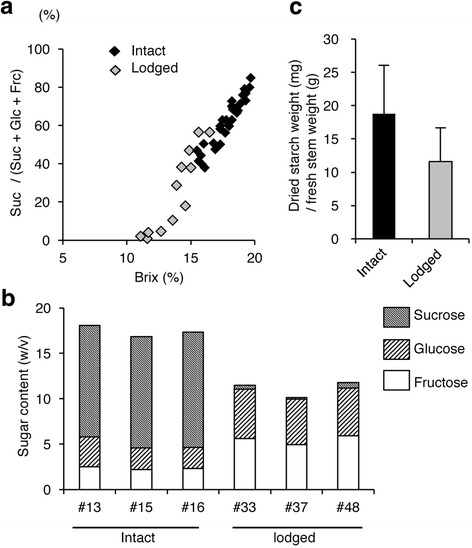
Fig. 1.

Differences in sugar content, sugar composition, and starch content of stem between lodged and intact plants. a Brix and sucrose percentage. Horizontal axis represents Brix and vertical axis represents sucrose weight as a percentage of the total weights of sucrose, glucose, and fructose combined. Data on 36 intact plants (black) and 12 lodged plants (gray) are plotted. b Sugar composition. The contents (weight/volume) of sucrose, glucose, and fructose of three individual plants of intact (# 13, # 15, # 16) and lodged (# 33, # 37, # 48) sorghum are shown. c Starch content. The mean and standard deviation of the values of the starch content (dried starch weight (mg)/stem fresh weight (g)) for three individual intact (# 13, # 15, # 16) and lodged (# 33, # 37, # 48) plants are shown
