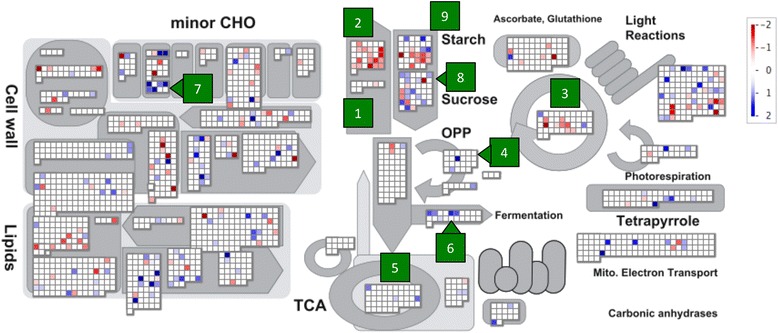
Fig. 3.

Relative expression levels of metabolism-associated genes in lodged and intact plants. Each box represents 2778 predicted genes involved in metabolic pathways; these genes were annotated with MapMan software. Colors represent relative expression levels: significantly higher in intact plants (red); significantly higher in lodged plants (blue); no significant difference (white). Green numbers represent metabolic pathways discussed in the main text. 1: sucrose synthesis; 2: starch synthesis; 3: Calvin cycle; 4: pentose phosphate pathway; 5: TCA cycle; 6: fermentation; 7: trehalose synthesis; 8: sucrose degradation; 9: starch degradation
