Fig. 3.

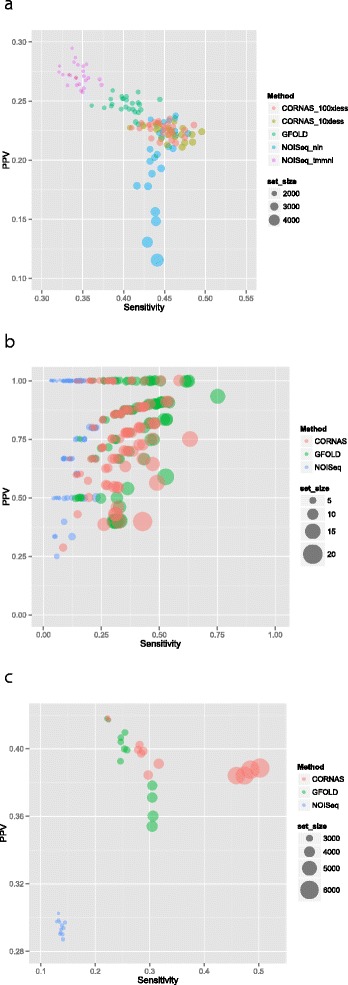
Scatterplots of PPV against sensitivity. The size of each dot is proportional to the DEG set size. a compcodeR simulation, b Human sex-specific gene expression, c Human tissue-specific gene expression

Scatterplots of PPV against sensitivity. The size of each dot is proportional to the DEG set size. a compcodeR simulation, b Human sex-specific gene expression, c Human tissue-specific gene expression