
Figure 4.
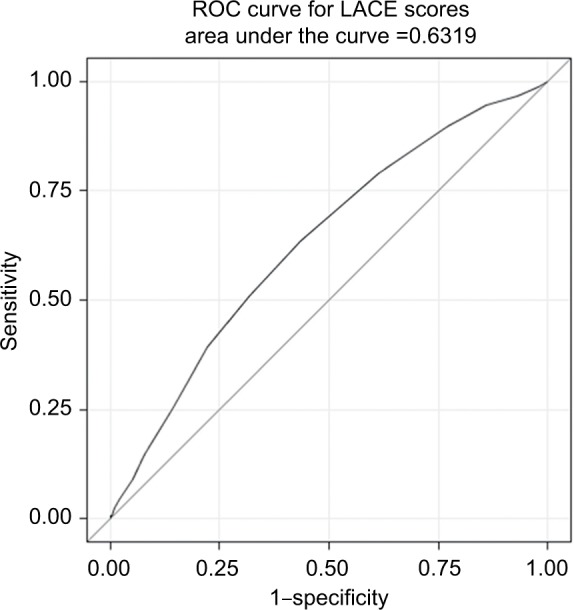
ROC curve for the LACE index in COPD.
Notes: The ROC curve illustrates the performance of the LACE index for predicting 30-day readmission at different cutoff points. With increased sensitivity, specificity is decreased and vice versa. The area under the curve, which is equal to the C-statistic, is 0.63, indicating a moderate predictive ability of the model for identifying patients at risk of readmission within 30 days.
Abbreviations: COPD, chronic obstructive pulmonary disease; ROC, receiver operator characteristic.