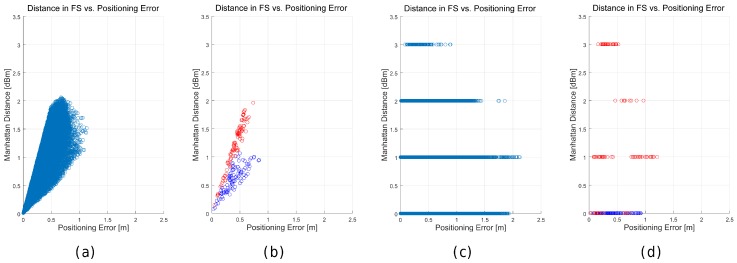
Figure 25.
Relation between the distance in the feature space (Manhattan)—y axis—of the best match and the positioning error—x axis—for the happy world (a,b) and the quantized world (c,d). (a,c) show all the tuples generated in the 100 simulations in all the scenarios; whereas (b) and (d) show the tuples generated in the 100 simulations in two representative cells.

