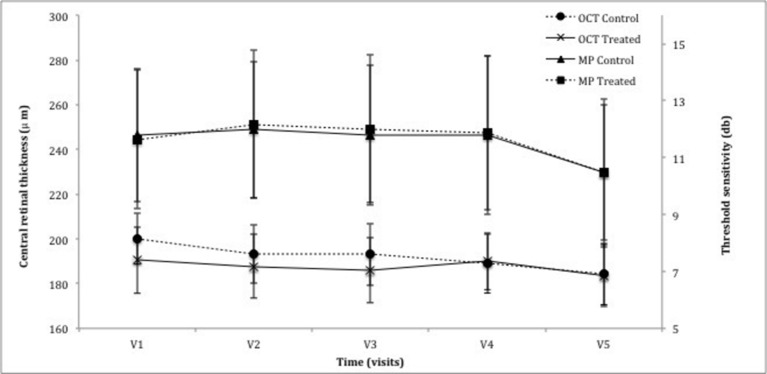
Figure 2.
Graph demonstrating the change in central parameters of central retinal thickness (CRT) as measured by optical coherence tomography (OCT) and threshold sensitivity of the central 10 degrees using the MAIA microperimeter (MP). There was no statistical significance noted between the control eye and treated eye following the treatment period (CRT: P=0.91, MP: P=0.68) or the observation period (CRT: P=0.52, MP: P=0.43).

