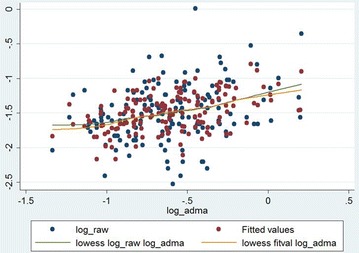
Fig. 3.

The model of correlation of airway resistance (Raw) and asymmetric dimethylarginine (ADMA) serum concentration. The blue dots indicate the raw (i.e. original) data, while the red dots indicate the fitted values obtained by multiple linear regression. The green and orange lines indicate the fitted curves for raw data and for data provided by multiple regression. The fitted curves were obtained by locally weighted scatterplot smoothing (lowess)
