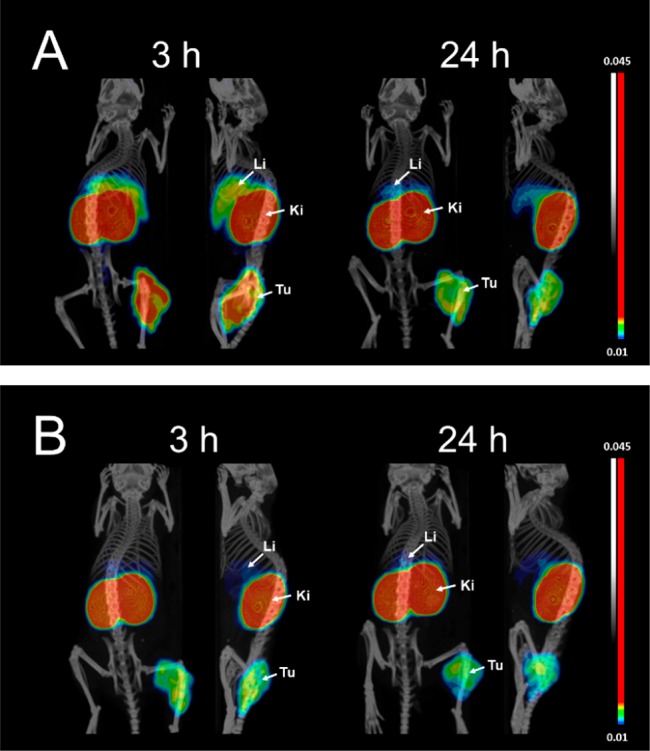
Figure 6.

Imaging of EGFR-expression in A431 tumor xenografted BALB/C nu/nu mice using high temperature radiolabeled 89Zr-FSC-ZEGFR:2377 (A) and 89Zr-DFO-ZEGFR:2377 (B) at 3 and 24 h post injection (Li = liver; Ki = kidneys; and Tu = tumor). Coronal/sagittal PET-CT images are shown as maximum intensity projections (MIP) in RGB color scale.
