
Figure 3.
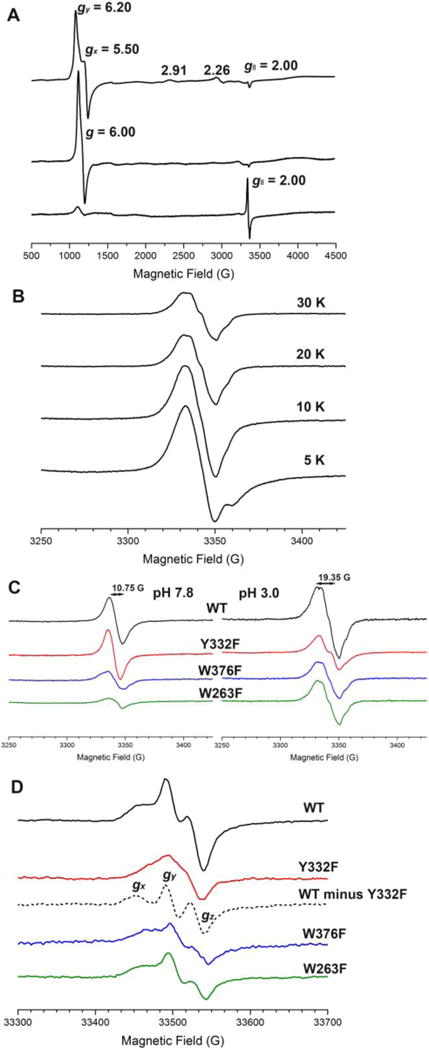
EPR spectra. (A) X-band spectra of 1.0 mM wt-TcDyP at pH 7.8 (top), 0.1 mM wt-TcDyP at pH 3.0 (center), and 0.1 mM wt-TcDyP plus 1.0 mM H2O2 at pH 3.0 (bottom) recorded at 5 K; (B) Temperature-dependent X-band spectra of 0.1 mM wt-TcDyP reacted with 1.0 mM H2O2 at pH 3.0; (C) X-band spectra of 1.0 mM TcDyPs at pH 7.8 (left) and 0.1 mM TcDyPs at pH 3.0 (right) reacted with 10 equiv. H2O2 recorded at 20 K; (D) W-band spectra of 0.2 mM TcDyPs reacted with 10 equiv. H2O2 at pH 3.0 and 30 K.