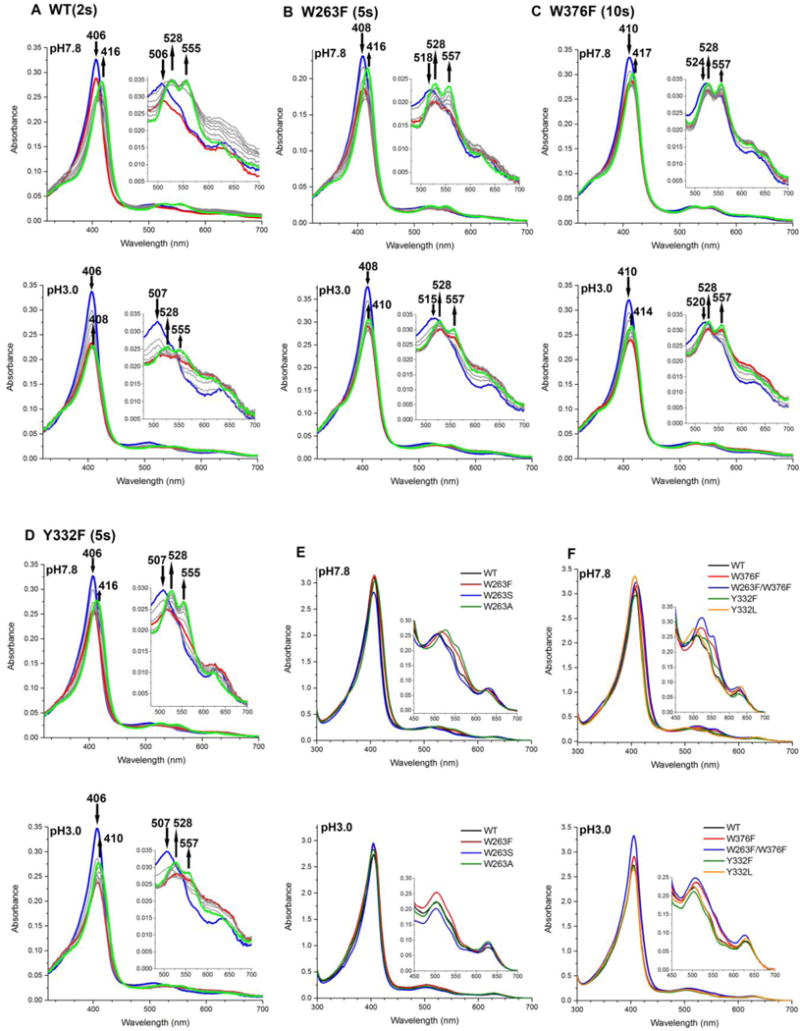
Figure 8.

Stopped-flow spectra of reactions between TcDyPs and H2O2 at 1:1 ratio (A–D) and spectral overlay of enzyme resting states (E–F). The blue, red, and green lines in A–D represent initial, intermediate, and final states of the enzymes, respectively. Reactions were performed with 5 μM enzymes at pH 7.8 (top panel) and 3.0 (bottom panel). Arrows indicate changes of absorbance over time.
