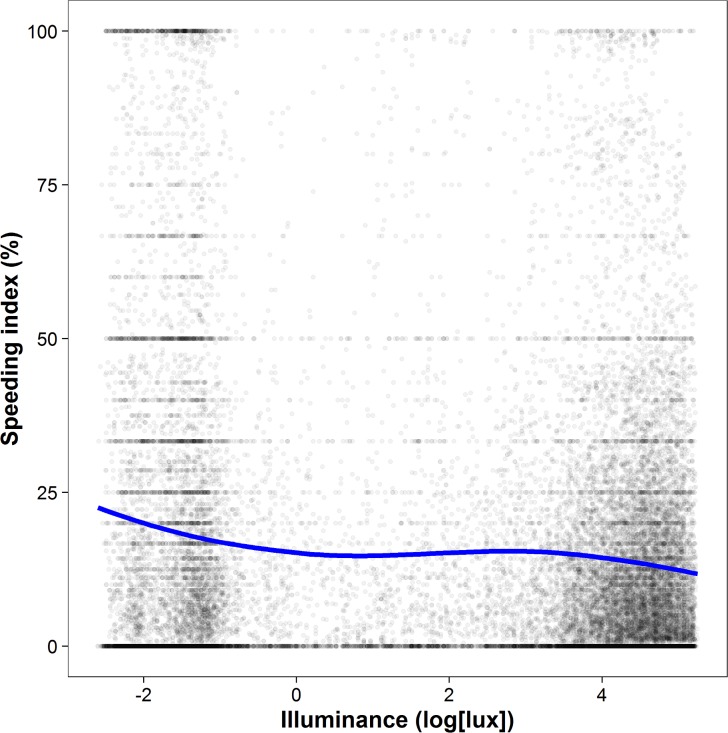
Fig 1. The inverse illuminance‒speeding relationship.
Each data point depicts a road at a given hour and represents 1 to 640 vehicles depending on traffic volume. The blue line represents a loess curve (i.e., local polynomial regression fitting). Results show a negative relation between illuminance (log[lux]) and speeding at low and high illuminance levels, but not at intermediate illuminance levels. Note that removing outliers (e.g., data points with a speeding index of 0 and 100) or less frequented roads (e.g., data points with a traffic volume of 5 and below) did not change the overall pattern of results.

